Help Desk with Reporting & Analytics Capabilities
Features Include
Data Visualization
Revelation Helpdesk is packed with different reporting options for data visualization the way you want. With help desk reporting, you can create your own reporting dashboard using our tool, Slices, or design custom reports to meet your specific needs.
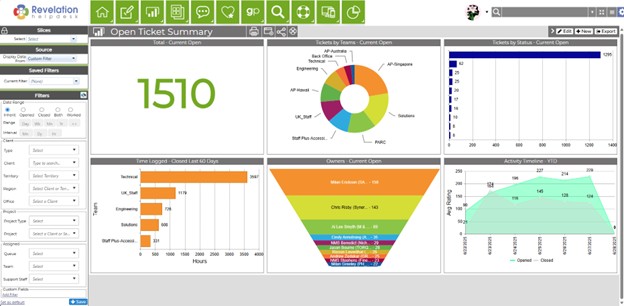
Slice your data any way you like to view charts for open tickets, response times, end users, and more, with our new and improved reporting tool, Slices.
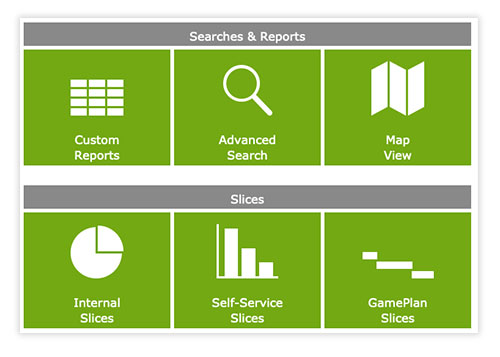
Revelation Helpdesk offers robust features for helpdesk reporting, allowing you to visualize your data the way you want. With our tool, Slices, you can create custom dashboards and reports tailored to your specific needs.
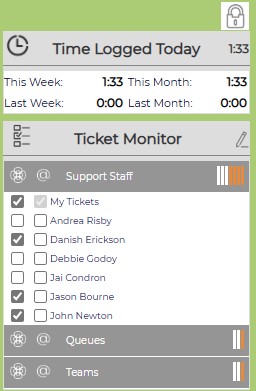
View a group of tickets or individual user tickets with our Ticket Monitor checklist on your home page.
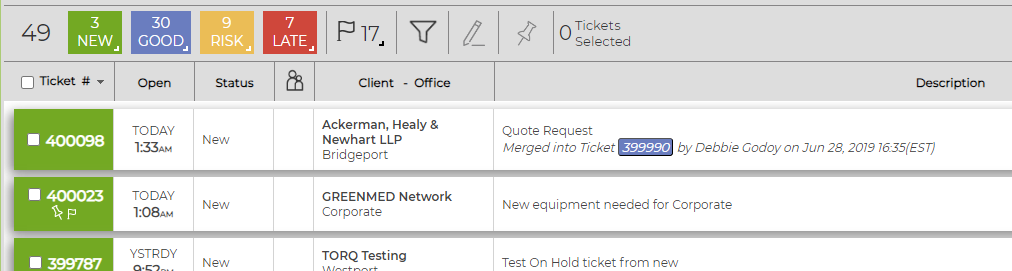
This interactive bar lets you know the current state of your tickets and what to look out for in the coming future. More than just a display, it’s a powerful tool for helpdesk reporting, allowing you to view and/or edit specific sets of tickets.
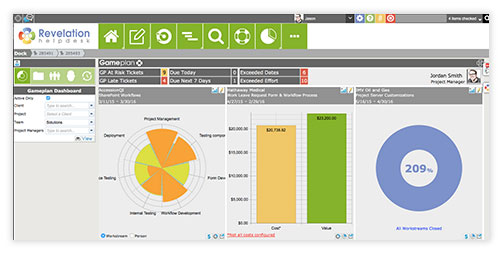
Revelation helpdesk also offers Project Tracking and Reporting with our gameplan add-on.
Extend your reporting with Power BI
Power BI is a business analytics service by Microsoft. Revelation reporting can be extended for more complex visualizations and BI reports using this toolset.
